
Go Math! Grade 4, Chapter 18: Represent and Interpret Data
In this unit, your child organizes data in frequency tables and finds the mode, median, and range of a set of data. They make and read line plots of measurements in fractions of a unit, like 1/8 inch, and solve problems by adding and subtracting those fractions. They also make and read stem-and-leaf plots.

By Robert “Bobby” BarnettMath teacher, parent, and founder of Bobby’s Math Club
Sample questions to try together
These are real questions from our practice. Tap the speaker to hear one read aloud, or the light bulb for a hint, and talk about the answer together.
Question 1 of 3
Zoe measured some pumpkin seeds. The marks on the line are 1/8 inch apart. She lines up her two shortest seeds end to end. How long are the two seeds together?
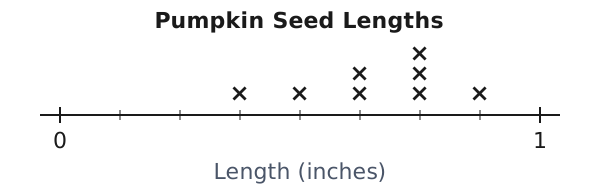
- 7/16 inch
- 1/8 inch
- 7/8 inch
What is my child learning in Chapter 18?
- Making line plots of measurements in halves, fourths, and eighths of an inch, and using them to find the difference between the longest and shortest. Learn more: Charting measurements in halves, fourths, and eighths
How you can help
- Measure some leaves or pencils to the nearest 1/4 inch together, make a line plot with X marks, and ask your child how much longer the longest is than the shortest.
- Write down the high temperature each day for a week, and ask your child to find the median and the range.
- Take a quick vote on a favorite fruit with friends or family, make a frequency table together, and ask which answer is the mode.
Where kids can get stuck
- Finding the median without first putting the numbers in order.
- Mixing up the mode, the most common value, with the median, the middle value.
- Placing an X for 2 3/8 inches at 2 3/4 because the marks between whole numbers are hard to read.
Practice makes perfect
Bobby's Math Club has practice problems that adapt to your child’s level, each with a detailed explanation and an easy-to-follow video, so your child can build confidence in these skills one step at a time.
Words your child will hear
- data
- Information collected about something, often numbers.
- frequency table
- A table that shows how many times each value appears.
- mode
- The value that appears most often in a set of data.
- median
- The middle value when the data are put in order.
- range
- The difference between the greatest and least values.
- line plot
- A number line with X marks above it showing how often each value appears.
- stem-and-leaf plot
- A display that sorts numbers by their tens digit (stem) and ones digit (leaf).
Ready to build your child’s confidence with reading and making data displays?
In Bobby's Math Club, your child practices reading and making data displays at just the right level, with a hint when they need one, a clear explanation after every question, and kid-friendly videos. Unlimited practice is free.
Join the clubCurious about your child’s level?
Take a free placement test →
Written by Robert “Bobby” Barnett
Bobby is an award-winning math teacher, the author of Meet Every Learner’s Needs, and the father of two elementary-school math learners. He uses Bobby’s Math Club with his own kids a few times every week. Learn more or contact Bobby.
Which math standards does Go Math! Grade 4 Chapter 18 cover?
Go Math! Grade 4 Chapter 18 covers this math standard. Each one links to what it means, sample questions, and teaching strategies.
- 4.MD.B.4: Read line plots marked in fractions, like 1/4 and 1/8 inch.
For teachers: Unit names and order vary between editions and districts, so your school’s own materials have the exact sequence. Learn how Bobby's Math Club can help your students grow.