
Charting measurements in halves, fourths, and eighths
In 4th grade, children learn to make line plots of measurements in halves, fourths, and eighths of a unit; and to add and subtract those fractions to answer questions about the data.

By Robert “Bobby” BarnettMath teacher, parent, and founder of Bobby’s Math Club
Try these with your child
These are real questions from our 4th grade practice. Tap the speaker to hear one read aloud, or the light bulb for a hint, and talk about the answer together.
Question 1 of 3
Leila measured blades of grass in the schoolyard. The marks on the line are 1/8 inch apart. How much more must the tallest blade grow to be 3 inches tall?
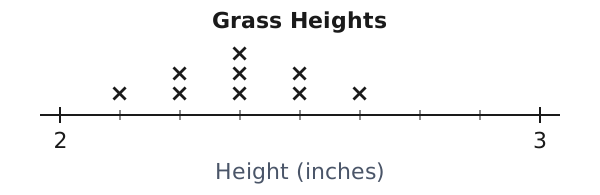
- 7/8 inch
- 3/8 inch
- 1/2 inch
Why this matters
Line plots give your child an early taste of reading data, a skill they will need in science, in later math, and in everyday life, from tracking how a plant grows to reading a chart in the news. They also give fractions a real use, since measurements rarely come out to whole numbers. In 5th grade your child uses line plots to share a total equally, and later studies data more deeply.
Where kids can get stuck
- Spacing 1/8, 1/4, and 1/2 as if they were equal steps apart on the number line.
- Putting 1/2 and 4/8 in different spots, so the plot shows two piles where there should be one.
- Adding the fraction values when the question asks how many, or counting the Xs when it asks for a total length.
How you can help
- Measure leaves, crayons, or toy cars with a ruler to the nearest quarter inch. Have your child draw a simple line plot on paper and put an X above each length.
- Measure your child's height each month on a door frame to the nearest half inch. Ask how much they grew between two dates, subtracting the fractions together.
- Use a ruler marked in eighths to compare two objects, such as a pen and a pencil. Ask your child to find the difference in length and say it in eighths, and in fourths or halves where that works.
Bobby's Math Club offers free practice that grows with your child.
Questions parents ask
Why is my child learning line plots with fractions this way?
Line plots let your child use fractions with real measurements, such as the lengths of pencils or the heights of plants. Plotting values on a number line marked in halves, fourths, and eighths strengthens their sense of where fractions sit and which ones are equal. Answering questions from the plot gives purpose to adding and subtracting fractions, rather than practicing them in isolation.
What is the difference between a line plot and a line graph?
A line plot shows how often each value appears in a set of data, using an X or dot above a number line for each one. A line graph shows how something changes over time, with points joined by lines, such as temperature across a day. Your child is learning line plots in 4th grade. Line graphs usually come later.
My child struggles to read the small marks on a ruler. How can I help?
Rulers with eighths have many lines, which can be confusing. Point out that the longest marks are inches, the next longest are half inches, then quarter inches, then eighths. Practice finding 1/2 inch, then 1/4 and 3/4, before moving to eighths. Measuring real objects at home, one size of mark at a time, builds confidence.
Make learning math fun
Bobby's Math Club turns 4th grade math practice into something fun to do together.
- Unlimited free practice
- Questions matched to your child’s level, a few minutes a day
- Level-ups, badges, and a cheer for every win

Written by Robert “Bobby” Barnett
Bobby is an award-winning math teacher, the author of Meet Every Learner’s Needs, and the father of two elementary-school math learners. He uses Bobby’s Math Club with his own kids a few times every week. Learn more or contact Bobby.
Ready to watch your child’s confidence grow?
Your 4th grade child can start today with free, unlimited practice that grows with them.
Join the clubNote for teachers: This skill is covered by Common Core math standard 4.MD.B.4: “Make a line plot to display a data set of measurements in fractions of a unit (1/2, 1/4, 1/8). Solve problems involving addition and subtraction of fractions by using information presented in line plots. For example, from a line plot find and interpret the difference in length between the longest and shortest specimens in an insect collection.” Learn how Bobby's Math Club can help your students grow. (Common Core 4.MD.4)