
Into Math Grade 2, Module 16: Data Representations
In this unit, your child collects survey data, records it in a tally chart, and shows it in picture graphs and bar graphs with up to four categories. They read graphs to answer questions like how many in all and how many more chose one answer than another, and draw their own graphs to share what they found.

By Robert “Bobby” BarnettMath teacher, parent, and founder of Bobby’s Math Club
Sample questions to try together
These are real questions from our practice. Tap the speaker to hear one read aloud, or the light bulb for a hint, and talk about the answer together.
Question 1 of 3
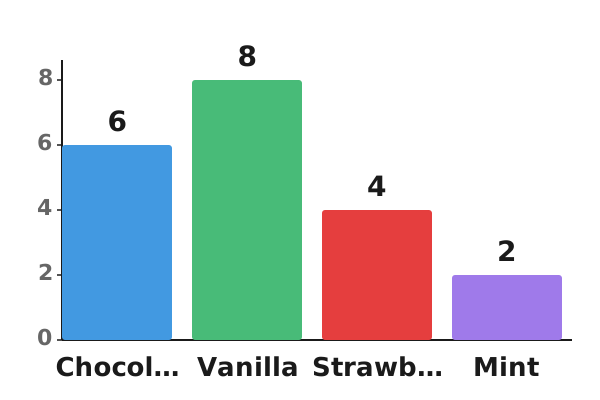
Look at the bar graph. Which ice cream flavor is the least popular?
- Mint
- Chocolate
- Vanilla
What is my child learning in Module 16?
- Collecting data, making picture graphs and bar graphs with up to four categories, and solving put-together, take-apart, and compare problems using the graph. Learn more: Making and reading picture graphs and bar graphs
How you can help
- Ask family or friends a question with four answers, like their favorite season, and help your child keep a tally chart.
- Turn the tally chart into a bar graph together on paper, then ask how many more chose the top answer than the bottom one.
- Make a picture graph of the fruit in your home, one picture for each piece, and ask which kind there is the most of.
Where kids can get stuck
- Reading across from the top of the wrong bar, so the number belongs to a different category.
- Adding the two amounts when asked how many more, instead of finding the difference.
- Drawing bars or pictures of different sizes, so the graph is hard to compare.
Practice makes perfect
Bobby's Math Club has practice problems that adapt to your child’s level, each with a detailed explanation and an easy-to-follow video, so your child can build confidence in these skills one step at a time.
Words your child will hear
- data
- Information you collect, like answers to a question.
- survey
- Asking people a question and recording their answers.
- tally chart
- A chart that uses tally marks to count answers.
- picture graph
- A graph that uses pictures to show data.
- bar graph
- A graph that uses bars of different lengths to show and compare amounts.
- category
- A group in a graph, like one answer to a survey question.
Want to help your child with graphs and data?
In Bobby's Math Club, your child practices graphs and data at just the right level, with a hint when they need one, a clear explanation after every question, and kid-friendly videos. Unlimited practice is free.
Join the clubCurious about your child’s level?
Take a free placement test →
Written by Robert “Bobby” Barnett
Bobby is an award-winning math teacher, the author of Meet Every Learner’s Needs, and the father of two elementary-school math learners. He uses Bobby’s Math Club with his own kids a few times every week. Learn more or contact Bobby.
Which math standards does Into Math Grade 2 Module 16 cover?
Into Math Grade 2 Module 16 covers this math standard. Each one links to what it means, sample questions, and teaching strategies.
- 2.MD.D.10: Draw a picture graph and a bar graph to represent a data set with up to four categories.
For teachers: Unit names and order vary between editions and districts, so your school’s own materials have the exact sequence. Learn how Bobby's Math Club can help your students grow.