
2nd Grade · Measurement & Data
2.MD.D.10: Draw a picture graph and a bar graph to represent a data set with up to four categories
2.MD.D.10 is a 2nd grade Common Core math standard in Measurement & Data. Here’s what it really covers, and how you can help your students learn it.

By Robert “Bobby” BarnettMath teacher, parent, and founder of Bobby’s Math Club
The standard
Draw a picture graph and a bar graph (with single-unit scale) to represent a data set with up to four categories. Solve simple put-together, take-apart, and compare problems using information presented in a bar graph.
In plain words
Draw a picture graph and a bar graph to represent a data set with up to four categories.
Sample questions from student practice
These questions from Bobby's Math Club are the kinds of questions your students will see. You can try answering them to see what a student might see.
Question 1 of 3
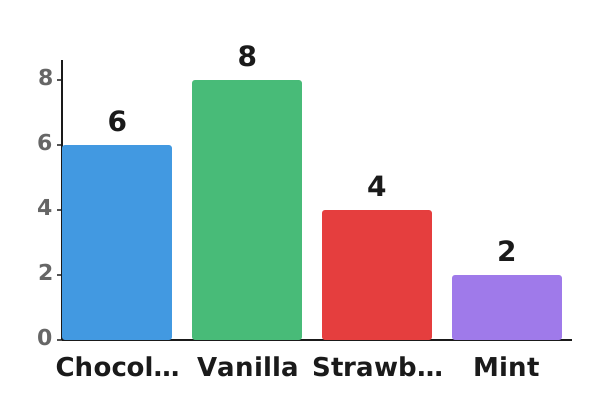
Look at the bar graph. Which ice cream flavor is the least popular?
- Mint
- Chocolate
- Vanilla
Where students can get stuck
- Drawing bars of uneven widths, or starting them at different heights, so some categories look bigger than they are.
- Reading a bar's height from the wrong spot, such as the top of the label, and ending up one off.
- Answering a compare question with a total, saying 10 for how many more apples than grapes when there are 6 and 4.
Effective teaching strategies
- Have students draw a picture graph with one picture for each item, then turn it into a bar graph by shading the same number of equal squares for each category.
- Ask students to start every bar on the same baseline with the same width, and to follow the top of each bar across to the scale with a finger.
- Pose put-together and compare questions about the same graph, such as 7 apples and 3 grapes, so students see 7 + 3 = 10 in all but 7 - 3 = 4 more.
Units that teach this standard
Find where 2.MD.D.10 lands in the program you teach. Each unit has a guide written for families. Unit names and order vary between editions and districts, so your school’s own materials have the exact sequence.
Bridges in Mathematics
enVision Mathematics
Everyday Mathematics
Go Math!
i-Ready Classroom Mathematics
Illustrative Mathematics
Math Expressions
Reveal Math
Don’t see your curriculum? Contact Bobby and we’ll see if we can help!
Share it with families
Families can read Making and reading picture graphs and bar graphs for a plain-language look at this skill, with three questions to try together and ideas for helping at home.
Help every student practice measurement and data at home
In Bobby's Math Club, students practice at just the right level, with a hint when they need one, a clear explanation after every question, and kid-friendly videos. Unlimited practice is free for every family.
See how it works for teachers
Written by Robert “Bobby” Barnett
Bobby is an award-winning math teacher, the author of Meet Every Learner’s Needs, and the father of two elementary-school math learners. He uses Bobby’s Math Club with his own kids a few times every week. Learn more or contact Bobby.