
Making and reading picture graphs and bar graphs
In 2nd grade, children learn to draw picture graphs and bar graphs with up to four categories; and to solve put-together, take-apart, and compare problems using what they show.

By Robert “Bobby” BarnettMath teacher, parent, and founder of Bobby’s Math Club
Try these with your child
These are real questions from our 2nd grade practice. Tap the speaker to hear one read aloud, or the light bulb for a hint, and talk about the answer together.
Question 1 of 3
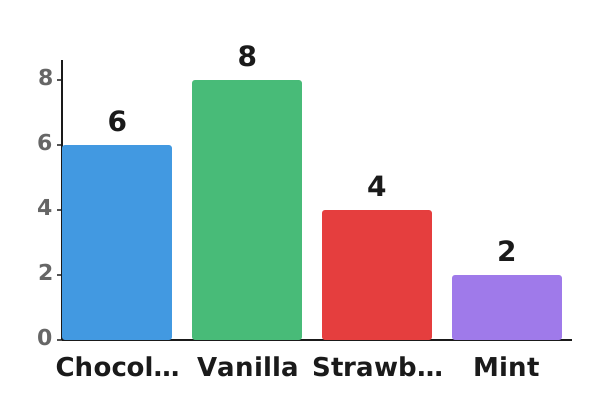
Look at the bar graph. Which ice cream flavor is the least popular?
- Mint
- Chocolate
- Vanilla
Why this matters
Graphs are one of the most useful ways your child will learn to make sense of information, in science class, in the news, and in everyday life. Answering questions about a graph also gives practice with adding and comparing. In 3rd grade, graphs use scales where one picture or square stands for several items, such as 2 or 5, so a solid start now matters.
Where kids can get stuck
- Drawing bars of uneven widths, or starting them at different heights, so some categories look bigger than they are.
- Reading a bar's height from the wrong spot, such as the top of the label, and ending up one off.
- Answering a compare question with a total, saying 10 for how many more apples than grapes when there are 6 and 4.
How you can help
- Survey family or friends about a question with up to four choices, such as favorite pet, then help your child make a picture graph on paper with one drawing per vote.
- Turn a bar graph into a game: count toy cars by color and stack blocks to make a bar for each color, then compare the towers.
- Ask questions about a graph your child made, such as "How many more chose dogs than fish?" and "How many people did you ask in all?"
The kid-friendly video below explains it in a few minutes, and Bobby's Math Club offers free practice that grows with your child.
Kid-friendly explanation
Questions parents ask
Why is my child making graphs in 2nd grade?
Making graphs helps your child organize information and see it clearly. It also gives practice with adding and comparing, such as finding how many more chose one option than another. Understanding how graphs are built prepares your child to read and make more complex graphs in later grades.
What is a single-unit scale?
A single-unit scale means each picture or each square on a graph stands for exactly one item. If 5 children chose bananas, the bar goes up 5 squares or the row shows 5 pictures. In 3rd grade, scales change so each picture or square can represent more than one, like 2 or 10.
What questions should my child be able to answer from a graph?
In 2nd grade, children answer questions like how many are in one category, how many in two or more categories together, and how many more or fewer one category has than another. For example, with 6 cats and 4 dogs, they find 10 in all and 2 more cats than dogs.
Make learning math fun
Bobby's Math Club turns 2nd grade math practice into something fun to do together.
- Unlimited practice, completely free
- A few minutes a day, at just the right level
- Level-ups, badges, and a cheer for every win

Written by Robert “Bobby” Barnett
Bobby is an award-winning math teacher, the author of Meet Every Learner’s Needs, and the father of two elementary-school math learners. He uses Bobby’s Math Club with his own kids a few times every week. Learn more or contact Bobby.
Ready to watch your child’s confidence grow?
Your 2nd grade child can start today with free, unlimited practice that grows with them.
Join the clubNote for teachers: This skill is covered by Common Core math standard 2.MD.D.10: “Draw a picture graph and a bar graph (with single-unit scale) to represent a data set with up to four categories. Solve simple put-together, take-apart, and compare problems using information presented in a bar graph.” Learn how Bobby's Math Club can help your students grow. (Common Core 2.MD.10)