
Reading picture graphs and bar graphs
In 3rd grade, children learn to draw and read picture graphs and bar graphs where each symbol or square stands for more than one, and to answer questions about how many more or fewer.

By Robert “Bobby” BarnettMath teacher, parent, and founder of Bobby’s Math Club
Try these with your child
These are real questions from our 3rd grade practice. Tap the speaker to hear one read aloud, or the light bulb for a hint, and talk about the answer together.
Question 1 of 3
Look at the bar graph. How many more students chose Green as their favorite color than Blue?
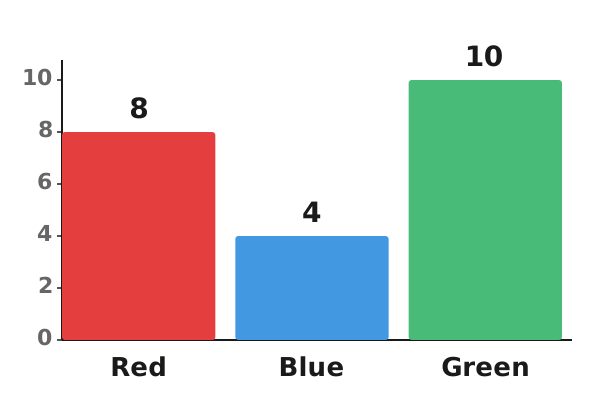
- 10
- 4
- 6
Why this matters
Graphs will meet your child everywhere, from news stories to sports scores, and reading the key correctly is what turns a picture into accurate numbers. Knowing that one star stands for 5 books also gives your child real practice with multiplication and comparing. In 4th and 5th grade they will make line plots with fractions and work with bigger sets of data, and careful graph reading supports science classes for years.
Where kids can get stuck
- Ignoring the key and counting each picture as one, so 4 stars worth 5 books each reads as 4 books instead of 20.
- Guessing at a bar that ends between lines, reading halfway between 10 and 20 as 11 or 19 instead of 15.
- Adding when the question asks how many more, so 30 books and 20 books gives 50 instead of 10.
How you can help
- Track something your family does over a week, such as the number of books read, and draw a picture graph where each smiley face stands for 2.
- Point out bar graphs in the newspaper, at the doctor's office, or on cereal boxes, and ask your child what each line on the side counts by.
- Count cars of different colors on a drive and help your child turn the tally into a bar graph that counts by 5s, then ask how many more were white.
If it’s helpful, you can sign up for free, adaptive practice in Bobby's Math Club.
Questions parents ask
What is a scaled graph?
A scaled graph uses one picture or one step on the side to stand for more than one thing. A key tells what each picture means, such as one apple standing for 10 apples sold. Scaled graphs let you show large numbers without drawing hundreds of pictures. In 3rd grade, scales usually count by 2s, 5s, or 10s.
Why does my child keep getting graph questions wrong when they can count?
The most common reason is skipping the key. If each square stands for 2, a bar of 6 squares means 12, not 6. Encourage your child to read the title, the labels, and the key before answering anything. Having them say aloud what one picture stands for is a quick habit that prevents many mistakes.
What are two-step graph questions?
These ask your child to do two things with the graph data. For example: "How many more students chose apples than chose bananas and grapes together?" Your child first adds bananas and grapes, then subtracts that total from apples. These questions build careful reading and planning, the same skills used in two-step word problems.
Make learning math fun
Bobby's Math Club turns 3rd grade math practice into something fun to do together.
- Free, unlimited practice for every child in your family
- Questions matched to your child’s level, a few minutes a day
- Hints when they are stuck, and a celebration when it clicks

Written by Robert “Bobby” Barnett
Bobby is an award-winning math teacher, the author of Meet Every Learner’s Needs, and the father of two elementary-school math learners. He uses Bobby’s Math Club with his own kids a few times every week. Learn more or contact Bobby.
Ready to watch your child’s confidence grow?
Your 3rd grade child can start today with free, unlimited practice that grows with them.
Join the clubNote for teachers: This skill is covered by Common Core math standard 3.MD.B.3: “Draw a scaled picture graph and a scaled bar graph to represent a data set with several categories. Solve one- and two-step "how many more" and "how many less" problems using information presented in scaled bar graphs. For example, draw a bar graph in which each square in the bar graph might represent 5 pets.” Learn how Bobby's Math Club can help your students grow. (Common Core 3.MD.3)